Dashboard
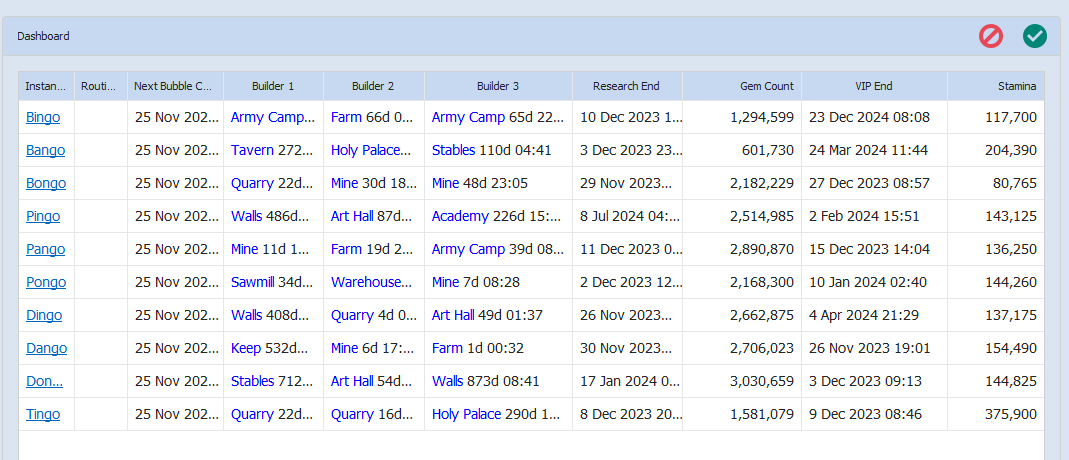
The dashboard provides an "At a glance" overview of your current instances.
You can see all your instances, their next bubble check time and the current state of their builders (assuming you have enabled the Status Checker routine).
The cells in the grid will highlight when the time is getting short. 2 Hours for the bubble and 24 hours for the builder.
You can also see which routine is currently running.
The data on this page refreshes every 10 seconds even if you are not looking at it so switch to another page when you no longer need it to save a few CPU cycles.
You can hide, resize and reorder columns using the right click menu or by dragging. The font size can be increased/decreased using the mouse wheel.
Consolidated Dashboard
If you have more than one computer running Ragebot, you can add those dashboards to your own using Remote Ragebot.
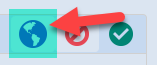
Press the Icon to open the Remote Ragebot interface. You can press this icon again to close it.
Add the URL and Api Key for each installation.
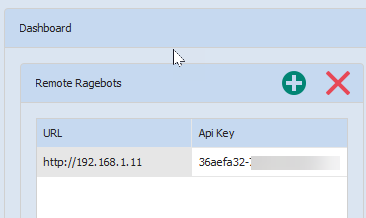
Once entered, your dashboard will update within a few seconds and show the details of the remote instances.
Remote instances are shown in a different colour and font to the local ones.